GEMINI-E3
An example of use
GEMINI-E3 is a CGE model specifically designed to assess the impact of climate change mitigation policies in different regions of the world. It was recently used to assess the commitments made at COP21 and a fair 2°C trajectory compatible with the objectives of the Paris Agreement. In another recent study, the model was extended to allow for a more detailed representation of the Gulf countries and their exposure to stranded asset risk. The model was built on the GTAP 9 database, with 2011 as the reference year. In this version, one detailed 10 groups (regions or coalitions) of countries, including the GCC countries; These are: the European Union (28 countries), the United States, China, India, the GCC, Russia, other Asian countries, other energy-exporting countries, Latin America and the rest of the world.7 Fossil fuel extraction is modelled according to carbon content in order to assess the ‘unburnable oil’ effect of climate change mitigation policies. Three fossil sectors/products were represented: coal, crude oil and natural gas. In the model, the impact of deep decarbonisation pathways on stranded fossil assets occurs through two main channels: (i) fossil resources located in energy-exporting countries lose their value, the energy rents associated with these resources decline (i.e., underground reserves become stranded assets), and welfare is directly negatively affected in the countries that own these resources; (ii) capital invested in energy sectors (coal mining, refineries, pipeline infrastructure) and energy-intensive industrial sectors depreciates further, which in turn has a negative impact on households that own these assets. In GEMINI-E3, as in most EGC models, households own capital and other resources, such as land or fossil fuels.
As a reference, below, see the paper showing the application of GEMINI-E3 to the economic assessment of a transition to zero-net emissions for Gulf countries. Click here to download the full paper in open access.
GEMINI-E3: Scope
GEMINI-E3 is a multisectoral and multinational computable general equilibrium (CGE) model. It simulates all relevant markets, both domestic and international, which are considered to be perfectly competitive. This implies that prices are flexible in the markets for raw materials (through relative prices), labour (through wages) and domestic and international savings (through interest rates and exchange rates). Periods are linked in the model by endogenous real interest rates, which are determined by the balance between savings and investment. National and regional models are linked by endogenous real exchange rates resulting from constraints on external trade deficits or surpluses. There is one notable – and usual – exception to this general assumption of perfect competition, which concerns foreign trade. Goods from the same sector produced by different countries are not assumed to be perfectly competitive; they are considered to be economically different goods, more or less substitutable according to an elasticity of substitution known as the Armington assumption. The main results of the GEMINI-E3 model are presented by country and by year: carbon taxes, marginal abatement costs and tradable permit prices (where applicable), effective CO2 emissions reductions, net sales of tradable permits (where applicable), total net welfare loss and its components (net loss due to terms of trade, deadweight loss due to taxation and net purchases of tradable permits, if applicable), macroeconomic aggregates (e.g., output, imports and final demand), real exchange rates and real interest rates, and industry-level data (e.g., changes in output and factors of production, and prices of goods).
Time Periods
GEMINI-E3 is a recursive-dynamic annual model with retrospective (adaptive) expectations. The model simulates the global economy until 2050. The model's reference year is 2017.
Data Base
The construction and calibration of the CGE model are based on economic and energy data that are generally contained in comprehensive databases created specifically for this purpose. In particular, the current version of GEMINI-E3 relies on GTAP Power 11, a database that provides a consistent representation of energy markets in physical units (tonnes of oil equivalent) as well as detailed socio-accounting matrices in US dollars for a wide range of countries or regions and bilateral trade flows. The GTAP database is supplemented by other information, notably on indirect taxation and public expenditure, mainly from the International Energy Agency (IEA), the OECD and the International Monetary Fund. Significant efforts have been made to harmonise all these sources of information. The result is a consistent social accounting matrix for each country/region.
Demographic assumptions
Population growth is exogenous and based on United Nations projections (United Nations 2019). The median projection is generally used. These projections are used to determine labour supply growth based on assumptions about participation rates by gender and age.
Technical progress and energy resources
Economic growth (i.e. GDP growth) and international energy prices (i.e. the price of crude oil, natural gas and coal) are generally based on the IEA's forecasts in its World Energy Outlook report (IEA, 2018). Technical progress in labour and energy resource dynamics are calibrated to replicate the figures provided by the World Energy Outlook.
Socio-economic dimensions
Like other global macroeconomic models, GEMINI-E3 endogenously determines all economic variables by sector, region and year. The model calculates the level of production (and associated inputs: labour, capital, energy and materials), as well as demand (household demand, investment and exports) by sector/good and by region. The prices associated with each good are determined endogenously. However, the dynamics of the model in the reference scenario are mainly
Autonomous improvement in energy efficiency
Finally, assumptions regarding technical progress related to energy consumption (i.e. autonomous improvement in energy efficiency) are determined exogenously and generally calibrated on the basis of historical data.
Economic indicators
GEMINI-E3 consistently provides numerous economic variables at the global and national/regional levels. The first set of variables concerns macroeconomic indicators such as:
• GDP
• Household and government consumption
• Investment
• Exports and imports
• Government savings
These variables are expressed in volume terms (i.e. at reference year prices), but the prices associated with each of these macroeconomic aggregates are also calculated (GDP prices, household consumption prices, etc.).
The second set concerns sectoral data:
• Production by sector
• Demand by sector and by use (final demand, intermediate use)
• Factors of production by sector (labour demand, energy consumption, capital, etc.)
Once again, for these sectoral data, price and volume changes are calculated.
Finally, the model provides international flows of goods and services (i.e. imports and exports) between the regions/countries described by the model.
Economic rationale and model solution
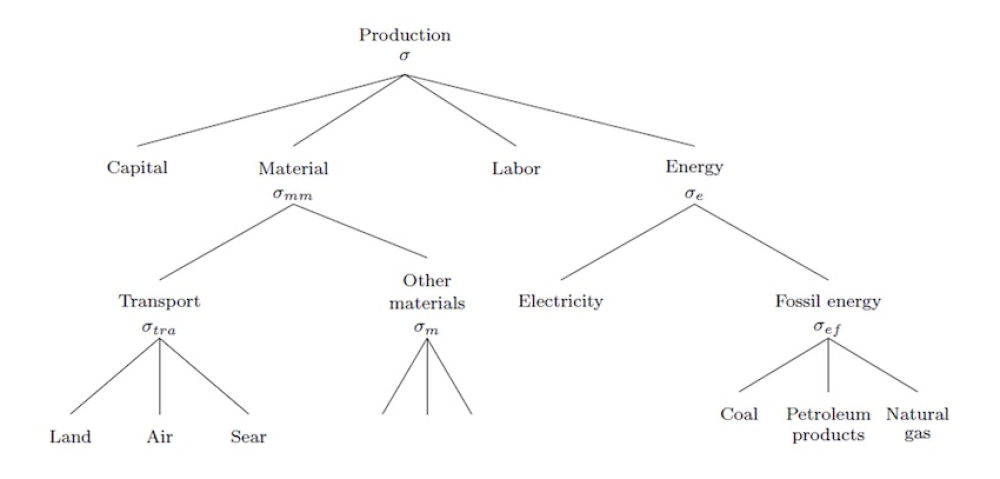
For each sector and region, the model calculates total demand as the sum of final demand (investment, consumption and exports) and intermediate consumption across all sectors. Demand is then split between imports and domestic production according to the Armington assumption. Domestic production technologies are described using nested CES functions, which differ across sectors. For example, the following figure shows the nested CES production structure of the sector producing ‘other goods and services’. Production is based on four aggregates: capital, labour, materials and energy. In a second step (nesting), materials and energy are broken down into individual goods using, again, CES functions.
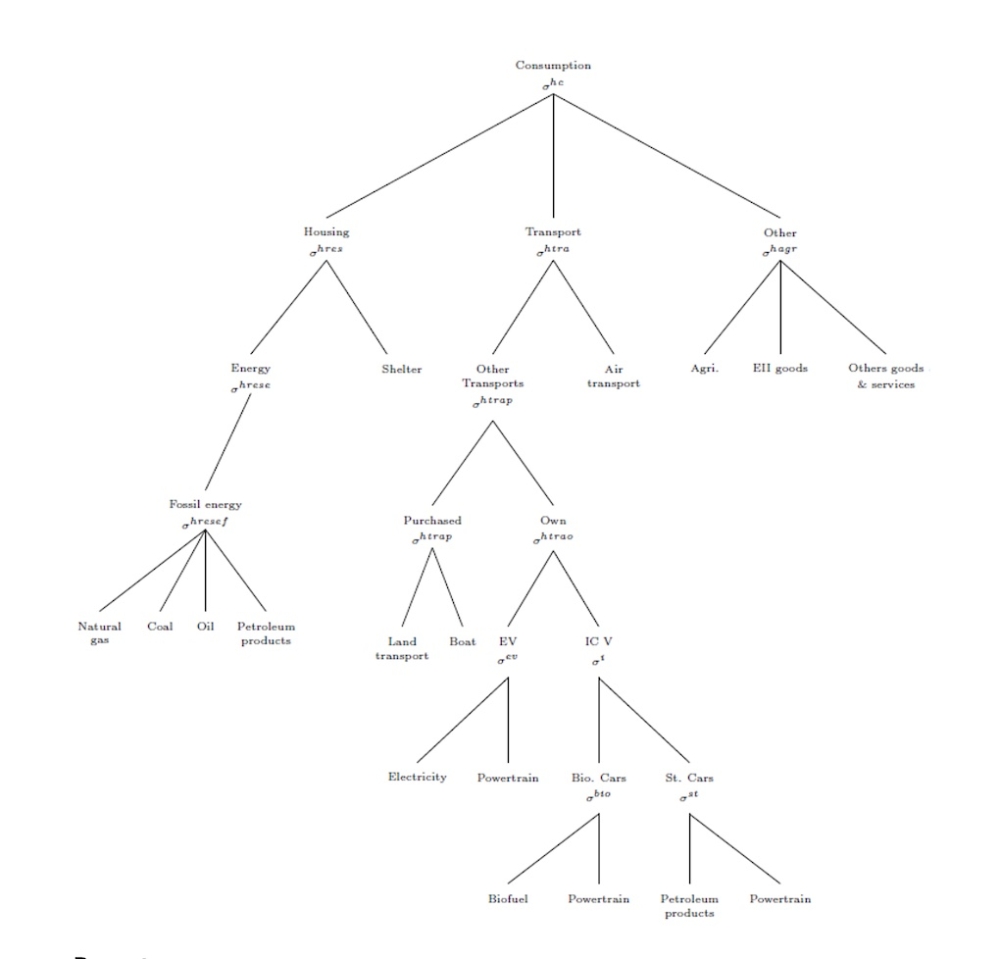
Household behaviour is based on three interdependent decisions: 1) labour supply; 2) savings; and 3) consumption of various goods and services. In GEMINI-E3, labour supply and the savings rate are assumed to be exogenous. Demand for different products is a function of consumer prices and income (more precisely, ‘spent’ income, i.e. income after savings) and is derived from nested CES utility functions. At the first level of the consumption function, households choose between three aggregates: housing, transport and other consumption. Energy consumption is divided into two parts: transport and housing. Transport demand is divided into purchased transport and own transport. The model distinguishes between three types of personal vehicles based on the fuel used. Electric vehicles (EVs), which are mainly intended for short or medium journeys, and two other types using the same engine (i.e. internal combustion, or IC), one using petroleum products and the other using biofuels. Each vehicle is characterised by a vehicle capital (called the powertrain in the following figure) and a type of fuel used (refined petroleum, biofuel or electricity).
Total government consumption is exogenous and its evolution over time, determined during model calibration, is a function of the growth rates of the main aggregates of the economy. The model distributes total consumption among goods on the basis of fixed budget shares.
Exports are the sum of imports from all other countries/regions, which are determined endogenously in the model.
Investment by product is derived from investment by sector using a transfer matrix. Investment by sector is determined from ‘anticipated’ capital demand using the CES function for each sector. Anticipated prices and production demand are based on adaptive expectations.
The public surplus or deficit corresponds to the difference between tax revenues (direct and indirect, including social security contributions) and expenditure, which is of two types: public consumption and transfers to households (mainly social benefits).
Recent uses
The model has been used for a wide range of economic analyses. More than 50 scientific publications have been published using the GEMINI-E3 model. The list below provides some recent illustrative examples:
- European Carbon Border Adjustment Mechanism
The European Carbon Border Adjustment Mechanism (CBAM) is a European policy that imposes a carbon price on imports of certain carbon-intensive goods, such as cement, iron and steel, aluminium, fertilisers, electricity and hydrogen, in order to ensure that these products are subject to the same carbon costs as those produced within the EU and to prevent carbon leakage. Importers must declare the emissions associated with these goods and, once the mechanism is fully implemented, purchase CBAM certificates reflecting the cost of carbon, thereby levelling the playing field for EU producers and those in third countries.
· Carbon border adjustment mechanism in the transition to carbon neutrality: collective implementation and distributional impacts, Perdana, S. and Vielle, M. (2023), Environmental Economics and Policy Studies, 25(3), pp. 299–329.
· Making the EU carbon border adjustment mechanism acceptable and climate-friendly for least developed countries, Perdana, S., Vielle, M. (2022), Energy Policy, 170, 113245
- Economic impact of the European embargo on Russian energy
The European Union has taken decisive measures to end its dependence on Russian energy, particularly in response to Russia's large-scale invasion of Ukraine in 2022. The embargo targets both Russian gas and oil, with the aim of completely eliminating imports by the end of 2027.
• European economic impacts of cutting energy imports from Russia: a computable general equilibrium analysis, Perdana, S., Vielle, M., Schenckery, M. (2022), Energy Strategy Review, 44, 101006
- Revision of Chilean climate policy
Chile recently updated its nationally determined contributions, moving from an intensity-based emissions reduction to an effective emissions target. This article aims to assess the economic and environmental impacts of this change in the current context of great uncertainty facing Chile with social protests and the COVID-19 pandemic. Using the computable general equilibrium model GEMINI-E3, we conducted a sensitivity analysis assuming different levels of economic growth until 2030.
· A post-COVID-19 economic assessment of the Chilean NDC revision, Babonneau, F., Vielle, M. (2023), Climate Change Economics 14(1), 2350002
- The European climate policy ‘Fit for 55’
The ‘Fit for 55’ policy is a comprehensive set of EU legislative measures aimed at reducing net greenhouse gas emissions by at least 55% by 2030 compared to 1990 levels, by aligning all sectors of the EU economy with the bloc's climate goals and paving the way for climate neutrality by 2050.
• A multi-model analysis of the EU's path to net zero, Boitier, B., Nikas, A., Gambhir, A., ... Zagamé, P., Mittal, S. (2023), Joule, 7(12), pp. 2760–2782